For each test, you can check the result and the data analysis.
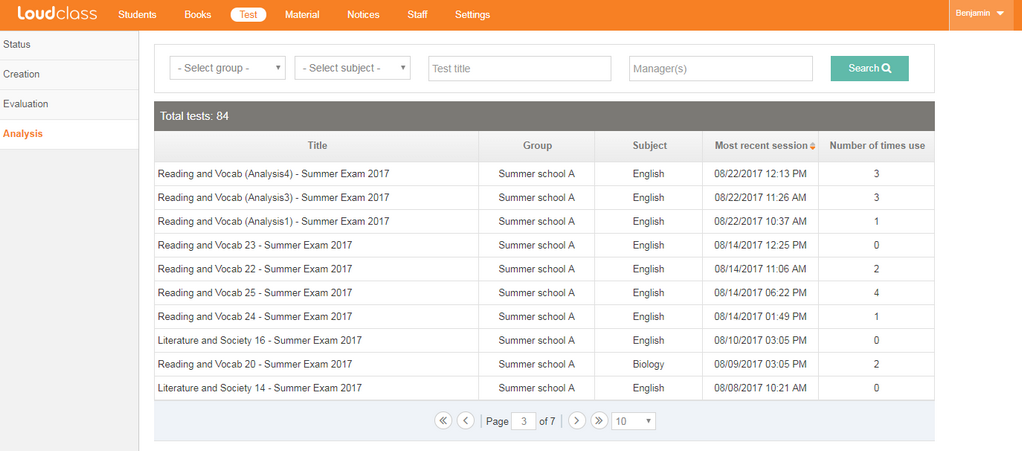
Test analysing
You can search by group / subject / test name / manager name
Test result analysis
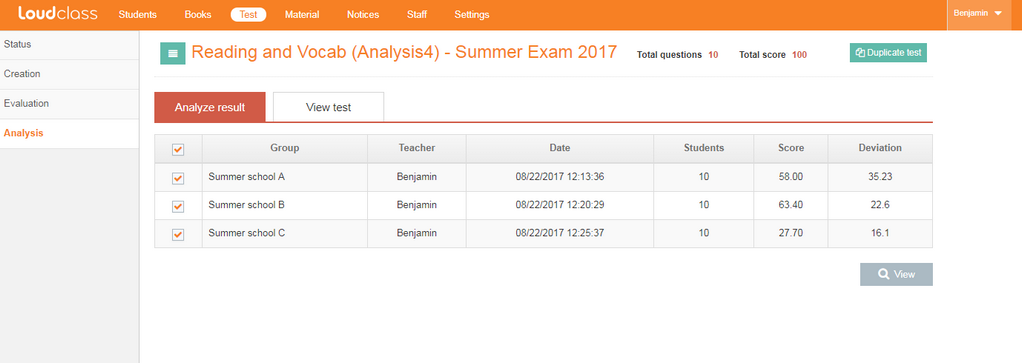
Analyze result
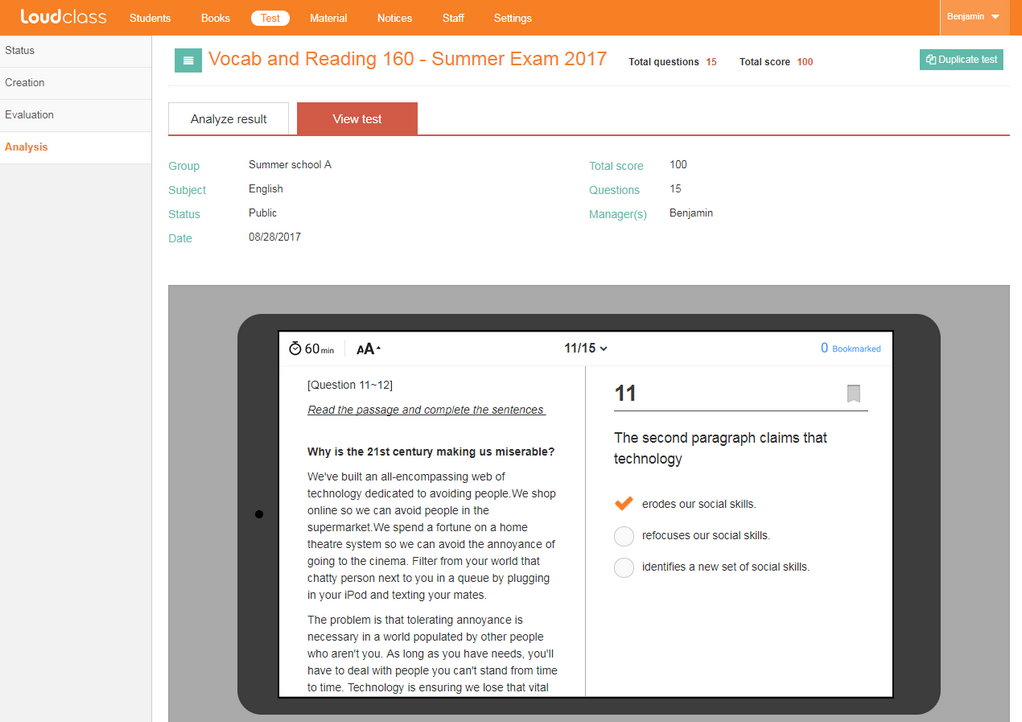
View test
- This is provided for all sessions of a particular test.
- If you select the “View test” tab, the test will open in the preview mode.
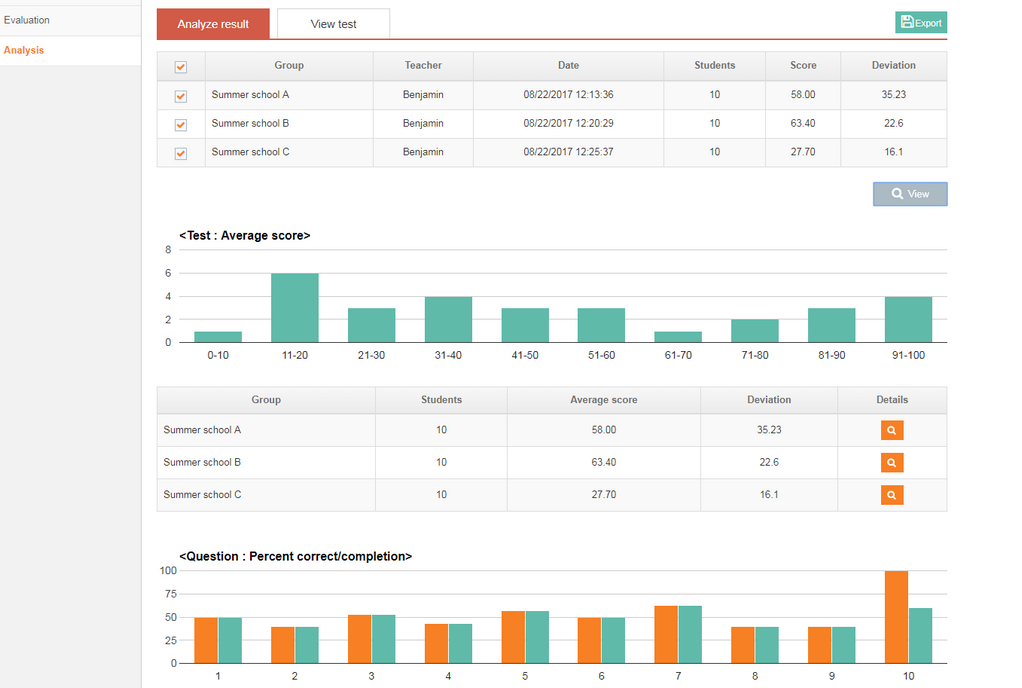
Average score and Percent correct completion
- If you select the session from the list and then the [View] button, you can see the score and data analysis.
- You can save the session result by selecting [Export].
- Test : Average score
For each session, the score distribution is displayed through a graph.
- If you select the [Details] button , a pop-up will appear displaying individual student results. (students who have not taken the test will not be displayed).
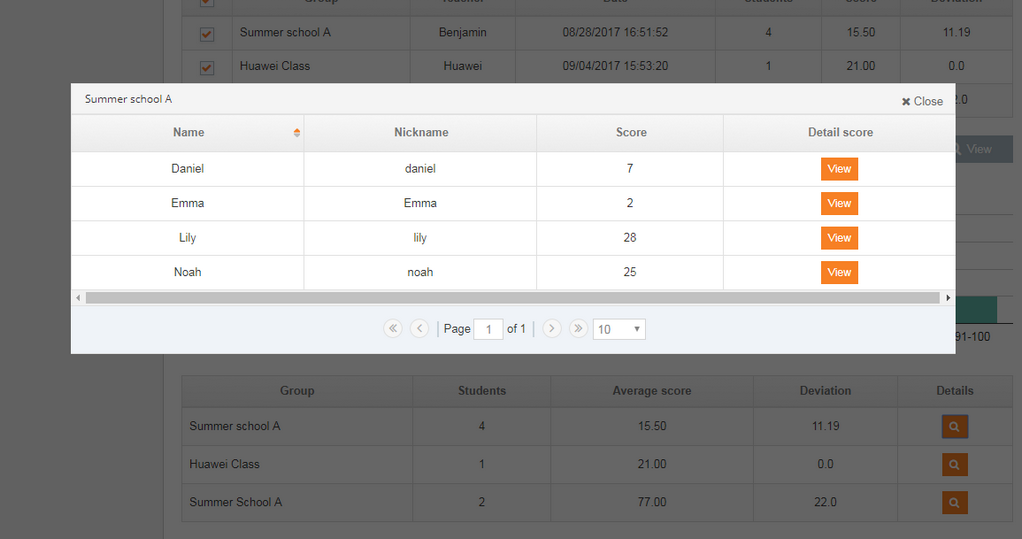
Detail score
Checking students’ scoring result
- In the pop-up window, you can see the score details of a particular student by selecting the [View] button.
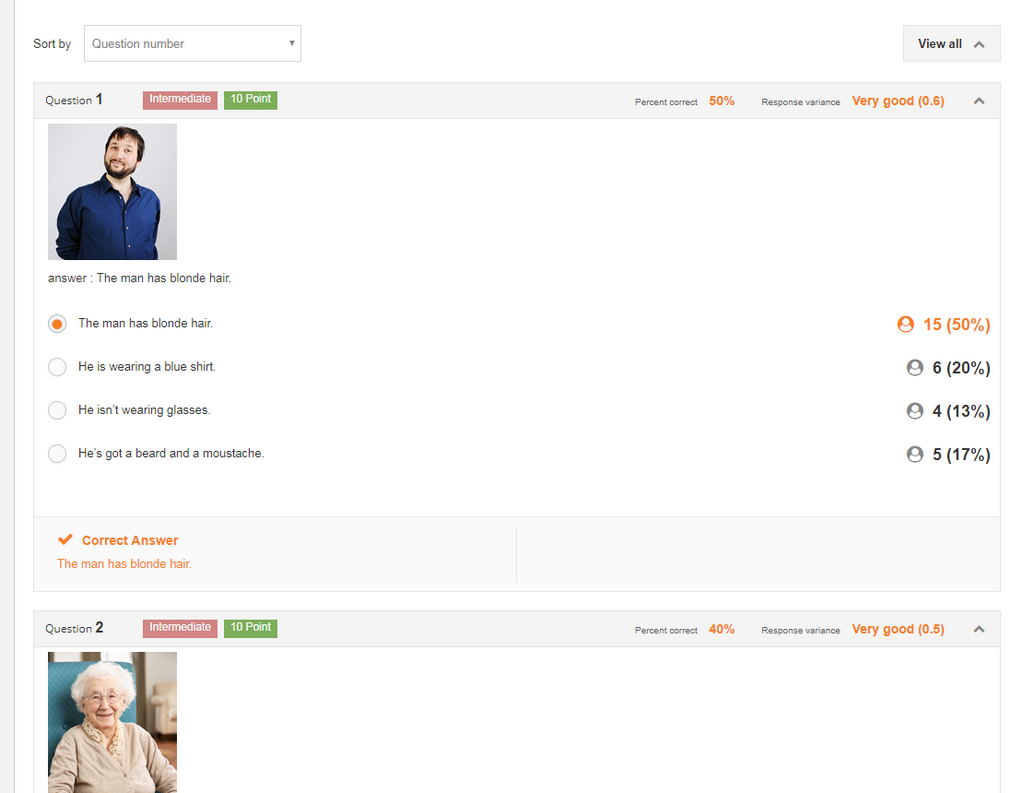
- Question : Percent correct/completion
For each question, you can check the correct and completion rate.
Tips
- Percent correct: Ratio of how many students answered the question correctly.
- Percent complete: Ratio of how many students submitted a response.
- Response variance
- Comparison of performance between groups for a particular question.
- Variance is higher for groups that have more students that get the question correct.
- Categorized by Very good / Good / Bad / Cannot evaluate.
Response variance